Global PV Market Outlook 2019~2023
It will be remembered in 2018, because photovoltaic installations have exceeded the annual 100 GW threshold, and when the installed PV total installed capacity reaches 500 GW or 0.5 TW, this moment may be recalled again.
It is also possible to go down in history in 2018, because this year solar PV showed a short "rest" in the next stage of growth. Last year, the world's total installed capacity 102.4GW grid. Compared to 2017 98.5GW installed capacity, an increase of 4%; but compared with the previous two years, the growth rate to fall, the first two years of very high growth rates --2017 Annual 30% in 2016 to 50%.
Net increase in power installed capacity in 2018
.jpg)
Renewable power generation and installed capacity (% of global power in 2008-2018)
.jpg)
Comparison of power generation costs between photovoltaic and other power sources from 2009 to 2018
.jpg)
Although year-on-year growth of solar photovoltaic is low, only a single digit, it is once again the largest power generation technology in the world with the largest installed capacity in 2018. The installed solar photovoltaic installation is more than any other single technology. In fact, the net increase in solar photovoltaic installed capacity in 2018 was more than twice the net increase in coal and wind power installed capacity that year. As in the previous year, the installed capacity of solar photovoltaic in 2018 is higher than the total installed capacity of all fossil fuels and nuclear power, although not much (less than 1%). Compared with fossil fuel power generation, the new installed capacity of solar PV seems impressive, but the fact is that there is still a long way to go before solar energy can tap its huge potential – it accounts for 20% of global electricity generation. The ratio is only 2%.
On the plus side, according to Lazard Capital, the level of solar photovoltaic (LCOE) in 2018 has dropped by about 14% year-on-year. Currently, many sunny places in the world generate electricity at 2 cents/kWh range
Just low power generation costs are not enough to promote growth, it also requires the right policy framework and energy market design. As the world's largest solar market for many years, the Chinese government cancelled the generous feed-in tariff subsidy system in mid-2018 to adapt to the era of grid parity, looking for tools to study to better guide growth and bring power generation closer to demand. In 2018, the installed capacity of China's PV market shrank to 44.4GW, a 16% decrease from the record of 52.8GW in 2017. While other major solar markets have stagnated or shrunk for various reasons (India, Japan), many emerging markets have made up for the weakness of the First Group. In 2018, 11 countries added more than 1 GW of installed capacity; compared with the 9 GW-scale solar markets in 2017, two more. Our medium-term scenario predicts that this number will increase significantly to 16 countries in 2019.
Europe is one of the new growth areas of solar energy. Driven by the EU's binding 2020 national target, the continent of Europe increased by 11.3 GW in 2018, an increase of 21% compared to 9.3 GW in the previous year. This year, our medium-term scenario forecast surges by more than 80% to 20.4GW, and in 2020, we see an installed capacity of 18% to reach 24.1GW, which will be a new installed record, surpassing the new European 2011. The installed capacity is 22.5GW.
While several emerging markets have seen impressive growth in 2018, Australia is probably the brightest "star" of last year. In 2018, Australia accelerated its phenomenal growth rate, with new installed capacity reaching 5.3 GW, an increase of nearly 300% from 1.3 GW in 2017 – a high demand that is expected to continue.
The world's lowest photovoltaic auction auction in 2018
.jpg)
Evolution of Global Solar photovoltaic Installed Capacity from 2000 to 2018
.jpg)
Top 10 photovoltaic Markets in the World in 2018
.jpg)
Global photovoltaic installations from 2000 to 2018
.jpg)
In our medium-term scenario, we expect 2019 will add about 128GW photovoltaic capacity, an increase of 25%. We are the world's largest PV market - China 2019 market conditions more optimistic than last year's "Global Market Outlook" in view of expected new installed capacity of 43GW. This is because the Chinese government’s actions to restructure seem to be faster than expected. In addition, for the next four years, we are optimistic about the global solar market. Our medium-term scenario predicts that demand in 2020 will increase by 12% to 144 GW, 10% to 158 GW in 2021, 7% to 169 GW in 2022, and 6% to 180 GW in 2023.
As in previous years, "2019 Global Market Outlook" scenario, compared with "Global Market Outlook" version of last year, higher growth. In 2019, we estimate that the cumulative installed capacity for the mid-2019 scenario is 645 GW, an increase of about 4% from last year's Global Market Outlook. Our new five-year global market outlook is projected to join our most likely medium-term scenario, and by 2023 global solar power installed capacity will reach 1,297 GW. Under optimistic conditions, we predict that by the end of 2023, the world's PV installed capacity may reach 1610GW, and by 2021, it will have entered the installed capacity of TW. However, the year that is more likely to be remembered after entering the TW era is 2022, and photovoltaic power generation may account for about 4% of global power generation.
.jpg)
World photovoltaic market situation from 2019 to 2023
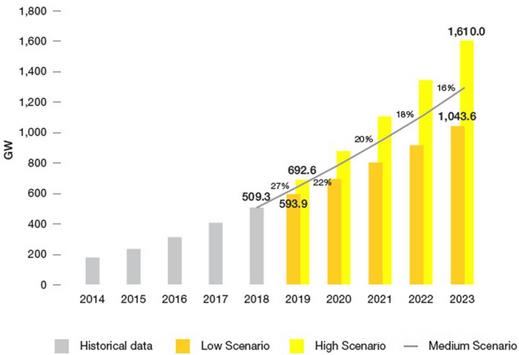
High and low scenarios, the evolution of the global solar photovoltaic market by 2023
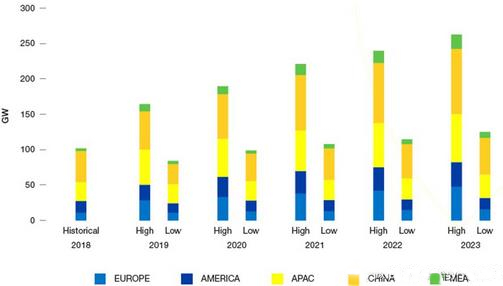
Photovoltaic installation increments in the top 20 markets under the high and low scenarios of 2019~2023
.jpg)
Global Photovoltaic Market Forecast
.jpg)